Data and Maps (legacy page, not updated recently)

| |||||
| The dea behind this page was to have data from current research on this eruption available to others AND some description of what it all means. However we have not been able to keep it up, but hope to make updates soon. For now, we give you the following few images to examine, reprinted from: Garcia, M., Rhodes, J. M., Trusdell, F. A. and Pietruszka, A., Petrology of lavas from the Pu`u `O`o eruption of Kilauea Volcano: III. The Pond stage (1986-1992). Bull. Volcanol. Feel free to email UH Prof. Mike Garcia with questions about this data. | |||||
|
Click on the Image thumbnails to see larger versions
|
|
| Maps |

|
Map of the on-going Pu`u `O`o eruption flow field (map covers 1983 to 31 Jan 1997 only). The Pu`u `O`o eruption is occurring on the East Rift Zone of Kilauea Volcano, Hawaii (modified after Mangan et al. 1995a). Lava has erupted primarily from two central vents during this period: Pu`u `O`o (episodes 2-47 and 50-55) and Kupaianaha (episode 48). Note, this map only includes flows through Episode 54. A fissure system formed between these vents during episode 49. Lavas from the Kupaianaha vent have extended the southern coastline of the island of Hawaii and destroyed numerous homes near the coast. The contour interval is 500 ft after the 100 ft contour. The insert shows the location of the eruption site on the island of Hawaii. This image by Brooks Bays and Nancy Hulbirt of SOEST Publication Services, based on maps published by USGS-HVO |

|
Hypothetical cross section of Kilauea's summit and subaerial portion of its east rift zone showing the inferred magma reservoir system for the Pu`u `O`o eruption based on seismic and petrologic data. The summit reservoir is probably a spherical body (Yang et al. 1992); the east rift zone conduit and the shallow Pu`u `O`o reservoir are dike-like bodies (Tilling and Dvorak 1993; Hoffmann et al. 1990). The rapid compositional variation in Pu`u `O`o lavas during episode 48 is circumstantial evidence that magma from the vertical mantle conduit avoids mixing with magma in the summit reservoir. Dates and locations of recent Kilauea eruptions are given for reference. Note the break in section in the upper part of the rift zone and the uncertain uprift margin of the evolved magma that fed the 1977 eruption. |
| Data | |
|
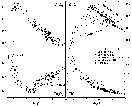
MgO variation diagrams for lavas from episodes 1-49 of the Pu`u `O`o eruption. The overall curved (TiO2) and kinked (Al2O3, CaO and Fe2O3) trends indicate that crystal fractionation was a dominant process controlling compositional variation for the eruption, although mixing was important during the early portion of the Pu`u `O`o eruption (squares for lavas from episodes 3-10 on the CaO diagram below kink). The scatter on these plots is greater than analytical error (2 sigma, which is about the size of the symbols except for Al2O3), indicating that the parental magma composition has changed during the eruption. All values are in wt%. The fields enclose episode 1 lavas; tie lines connect lavas from other episodes (3, 5-10, 30, 31) that have substantial compositional variations. The 1991-92 lavas include samples from the Kupaianaha, Pu`u `O`o and episode 49 vents. |
|
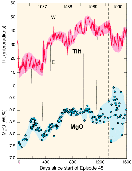
MgO (wt%) and summit tilt (E-W component in microradians) variations during the first 1600 days of episode 48, which began ~1300 days after the start of the eruption in 1983. Changes in summit tilt are followed 20 days later by changes in MgO content. This pattern stopped in early 1990 (marked by dashed line), when a period of frequent eruption pauses started. These pauses caused large variations in MgO content due to olivine accumulation or depletion |

|
Whole rock Mg# [(Mg/Mg + Fe2+) 100] versus forsterite content (Fo%) of olivine crystal cores. The Fe2+/ total iron content is assumed to be 0.9 based on iron redox determinations on Hawaiian tholeiites (Moore and Ault 1965). The solid circles are phenocrysts (0.5-2 mm in diameter); the horizontal lines are for microphenocrysts (0.1-0.5 mm). The numbers above each vertical line give the year in which the lava was erupted. The white field is the shallow pressure equilibrium field for basaltic magma (0.30 + 0.03; Roeder and Emslie 1970; Ulmer 1989). Most of the olivines plot within the equilibrium field, except the mafic lavas from 1990. Six of the lavas, spanning a wide compositional range (Mg# 58-63), have olivines with forsterite contents of ~85%. These olivines probably grew in a liquid of about 10 wt% MgO, which is the most MgO-rich lava observed during the Pu`u `O`o eruption. The arrow indicates the effect of olivine accumulation, which probably occurred in some of the mafic 1990 lavas. |
|
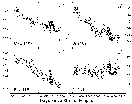
Temporal variation of CaO, Sr, K2O abundances normalized to 10 wt% MgO (the most MgO-rich composition erupted from Pu`u `O`o) for lavas from episodes 22-48 of the Pu`u `O`o eruption (some data from Garcia et al. 1992). Note the overall decrease in these contents and abundances during the course of the eruption. |
|
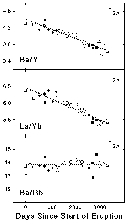
Temporal variation in ratios of highly (Ba/Rb) or highly over moderately incompatible elements (La/Yb and Ba/Y) for Pu`u `O`o lavas. The flat trend of the ratio of highly incompatible elements (and of Nd, Sr and Pb isotope ratios for episode 30 to 53) and the decrease of the other ratios during the course of the eruption indicate that the source of the Pu`u `O`o lavas has been relatively homogeneous but that either the degree of partial melting has progressively increased during the course of the eruption (which seems unlikely because the measured lava volumes have decreased during the eruption; Kauahikaua et al. 1996) or that the source is being systematically depleted of highly incompatible elements as the eruption proceeds. The 2 sigma error bar for each ratio is given in the upper right corner of each panel. |
|
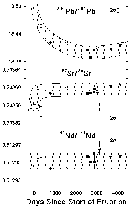
206Pb/204Pb, 87Sr/86Sr, 143Nd/144Nd isotopic variation during the Pu`u `O`o eruption. Pb isotopes show the greatest variation compared to analytical error and most of its variation is within the first two years of the eruption (a period of magma mixing). The Sr isotope ratio data define a similar but less well defined trend because of the small variation in this ratio relative to analytical error during the eruption. The Nd isotope ratio data show essentially no variation (i.e., within analytical error). Symbols with error bars are for data from other labs (open square- Newsom et al. 1986; others- Sims et al. 1995). |

 |
 |
 |
 |
||
| HCV Home | Hawaiian Volcanoes | Loihi | Kilauea | Mauna Loa | Hualalai |
This page created and maintained by Ken Rubin ©, krubin@soest.hawaii.edu
![]() Follow site author @kenrubin on Twitter
Follow site author @kenrubin on Twitter
Other credits for this web
site.
Volcano Quick Links
General Reference
Hawaiian volcano info:Links


