The 1996 Eruption at Loihi Volcano

The
1996 Eruption and July-August Seismic Event
This document contains an Introduction to the 1996 Eruption of Loihi
MOST RECENT ACTIVITY IS SUMMARIZED ON THE
LOIHI UPDATE PAGE
Visit these Recent Activity Links Too:

|
THE 1996 ERUPTION - WHAT HAPPENED?
The largest swarm of earthquakes ever recorded on ANY Hawaiian volcano
lasted for 2 months of summer 1996 at Loihi seamount (see graphic below).
It began on 17 July 1996 and by the end of August, a total of over 4000
earthquakes have been recorded by the Hawaii Volcano Observatory
(HVO) network, with more than 40 earthquakes between magnitude 4 and
5 recorded by the World Wide seismic network.
|
In August 1996, a National Science Foundation-funded expedition to Loihi
by UH scientists began investigating this unique event
and its origin. Additional "follow-up" expeditions to Loihi (including a
series of manned-submersible dives completed in August and September
of 1997) as well as a great deal of shore-based research have been conducted
since then. Ongoing results are described on the
Loihi Update Page
SUMMARY OF THE 1996 ERUPTION AND SEISMIC
EVENT (Compiled from the research of many individuals)
- There was at least one, possibly two eruptions at Loihi in 1996, based on
radiometric dating of young lavas collected by manned-submersible from Loihi
- The summit of Loihi has undergone some drastic changes in 1996, including
the formation of a third new pit crater and deposition of large quantities of
glassy sands and gravels on the southern part of the summit platform
- New vents issuing the hottest waters ever observed at Loihi (up to
200 ° C) are present in the new pit crater
- The water column above Loihi has signatures of enhanced hydrothermal
activity at or near the summit
Events with known dates are summarized in the image below (by Ken Rubin of
the Univ. of Hawaii). Included are the seismic swarm (shown as a histogram
of events in orange), the date of the initial Rapid Response Expedition to
Loihi in August of 1996, and the 210Po-210Pb
"eruption windows" (in red) of allowed
eruption dates for two samples collected in August
1996 from the Loihi summit. The small pink bars represent uncertainty in the
maximum age of lavas and the light purple t-bars (
---| ) depicts the date of sample
collection. Also shown is the calendar year 1997
running across the bottom of the figure. The info in this figure, as
well as results of other petrological and geochemical research on
lavas from this eruption are to described in this recently published
paper by UH scientists and their colleagues from other institutions:
Garcia, M., Rubin, K.H., Norman, M.D., Rhodes, J.M., Graham, D.W., Muenow, D.,
Spencer, K. (1998) Petrology and geochronology of basalt breccia from the
1996 earthquake swarm of Loihi Seamount, Hawaii: Magmatic history of its 1996
eruption. Bull. Volcanol. 577-592.
The histogram below of depicts seismic events during the "swarm".
Each red vertical bar represents a 6-hour time interval; the green swath
represents the time period during which the UH R/V KOK event response
cruise was at the seamount. (This figure contains unpublished
but copyright protected data. Use by permission of the webmaster only)
|
Earthquakes of the seismic swarm
at Loihi are depicted in the two diagrams below
(by Jackie Caplan-Auerbach at the UH; These figures contain unpublished
but copyright protected data. Use by permission of the webmaster only).
|
|
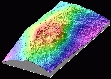
On the left, earthquakes from the
recent swarm have been superimposed on a bathymetric map of
the seamount
Click on either of these image to view them full-scale.
|
|
In this second image, the locations of
recent Hawaiian Earthquakes between 1 July and 22 Sept. 1996
(including those at Loihi)
are superimposed on a map of the Big Island of Hawaii.
Earthquakes are color-coded by date of occurence
(red = 1-19 July 1996, green = 19-31 July 1996, yellow = 1 Aug-22 Sept 1996).
|
 Return to the Hawaii Center for Volcanology LOIHI Page
 Return to the Hawaii Center for Volcanology Home Page
This page created and maintained by
Ken Rubin,©
krubin@soest.hawaii.edu
Last page update on 22 Jul 1998