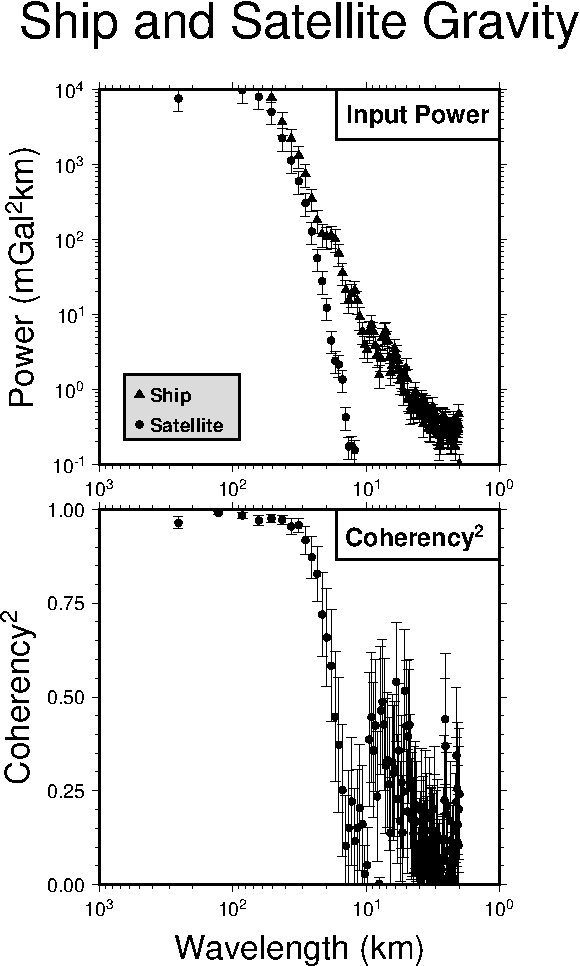
 Example 3. Two log10 diagrams showing a spectral comparison between gravity anomaly
estimates from ship gravity observations and Geosat altimetry. Calculations were
completed using the programs sample1d and spectrum1d; the composite black
and white figure was created with a shell script running the GMT programs
psxy and pstext which drew the symbols, axes, annotations, and legends.
Example 3. Two log10 diagrams showing a spectral comparison between gravity anomaly
estimates from ship gravity observations and Geosat altimetry. Calculations were
completed using the programs sample1d and spectrum1d; the composite black
and white figure was created with a shell script running the GMT programs
psxy and pstext which drew the symbols, axes, annotations, and legends.
 View GMT script.
 Download zipped PostScript file.
 Back
Back